
How to Create an Org Chart on Windows: The Ultimate Guide
An organizational chart, or org chart, is a crucial tool for businesses of all sizes. It maps out reporting lines, clarifies internal structures, and helps onboarding team members grasp who does what. However, building these charts in tools like Microsoft Word or Excel can be a manual formatting nightmare. Let's look at how to build beautiful, dynamic org charts natively on Windows.
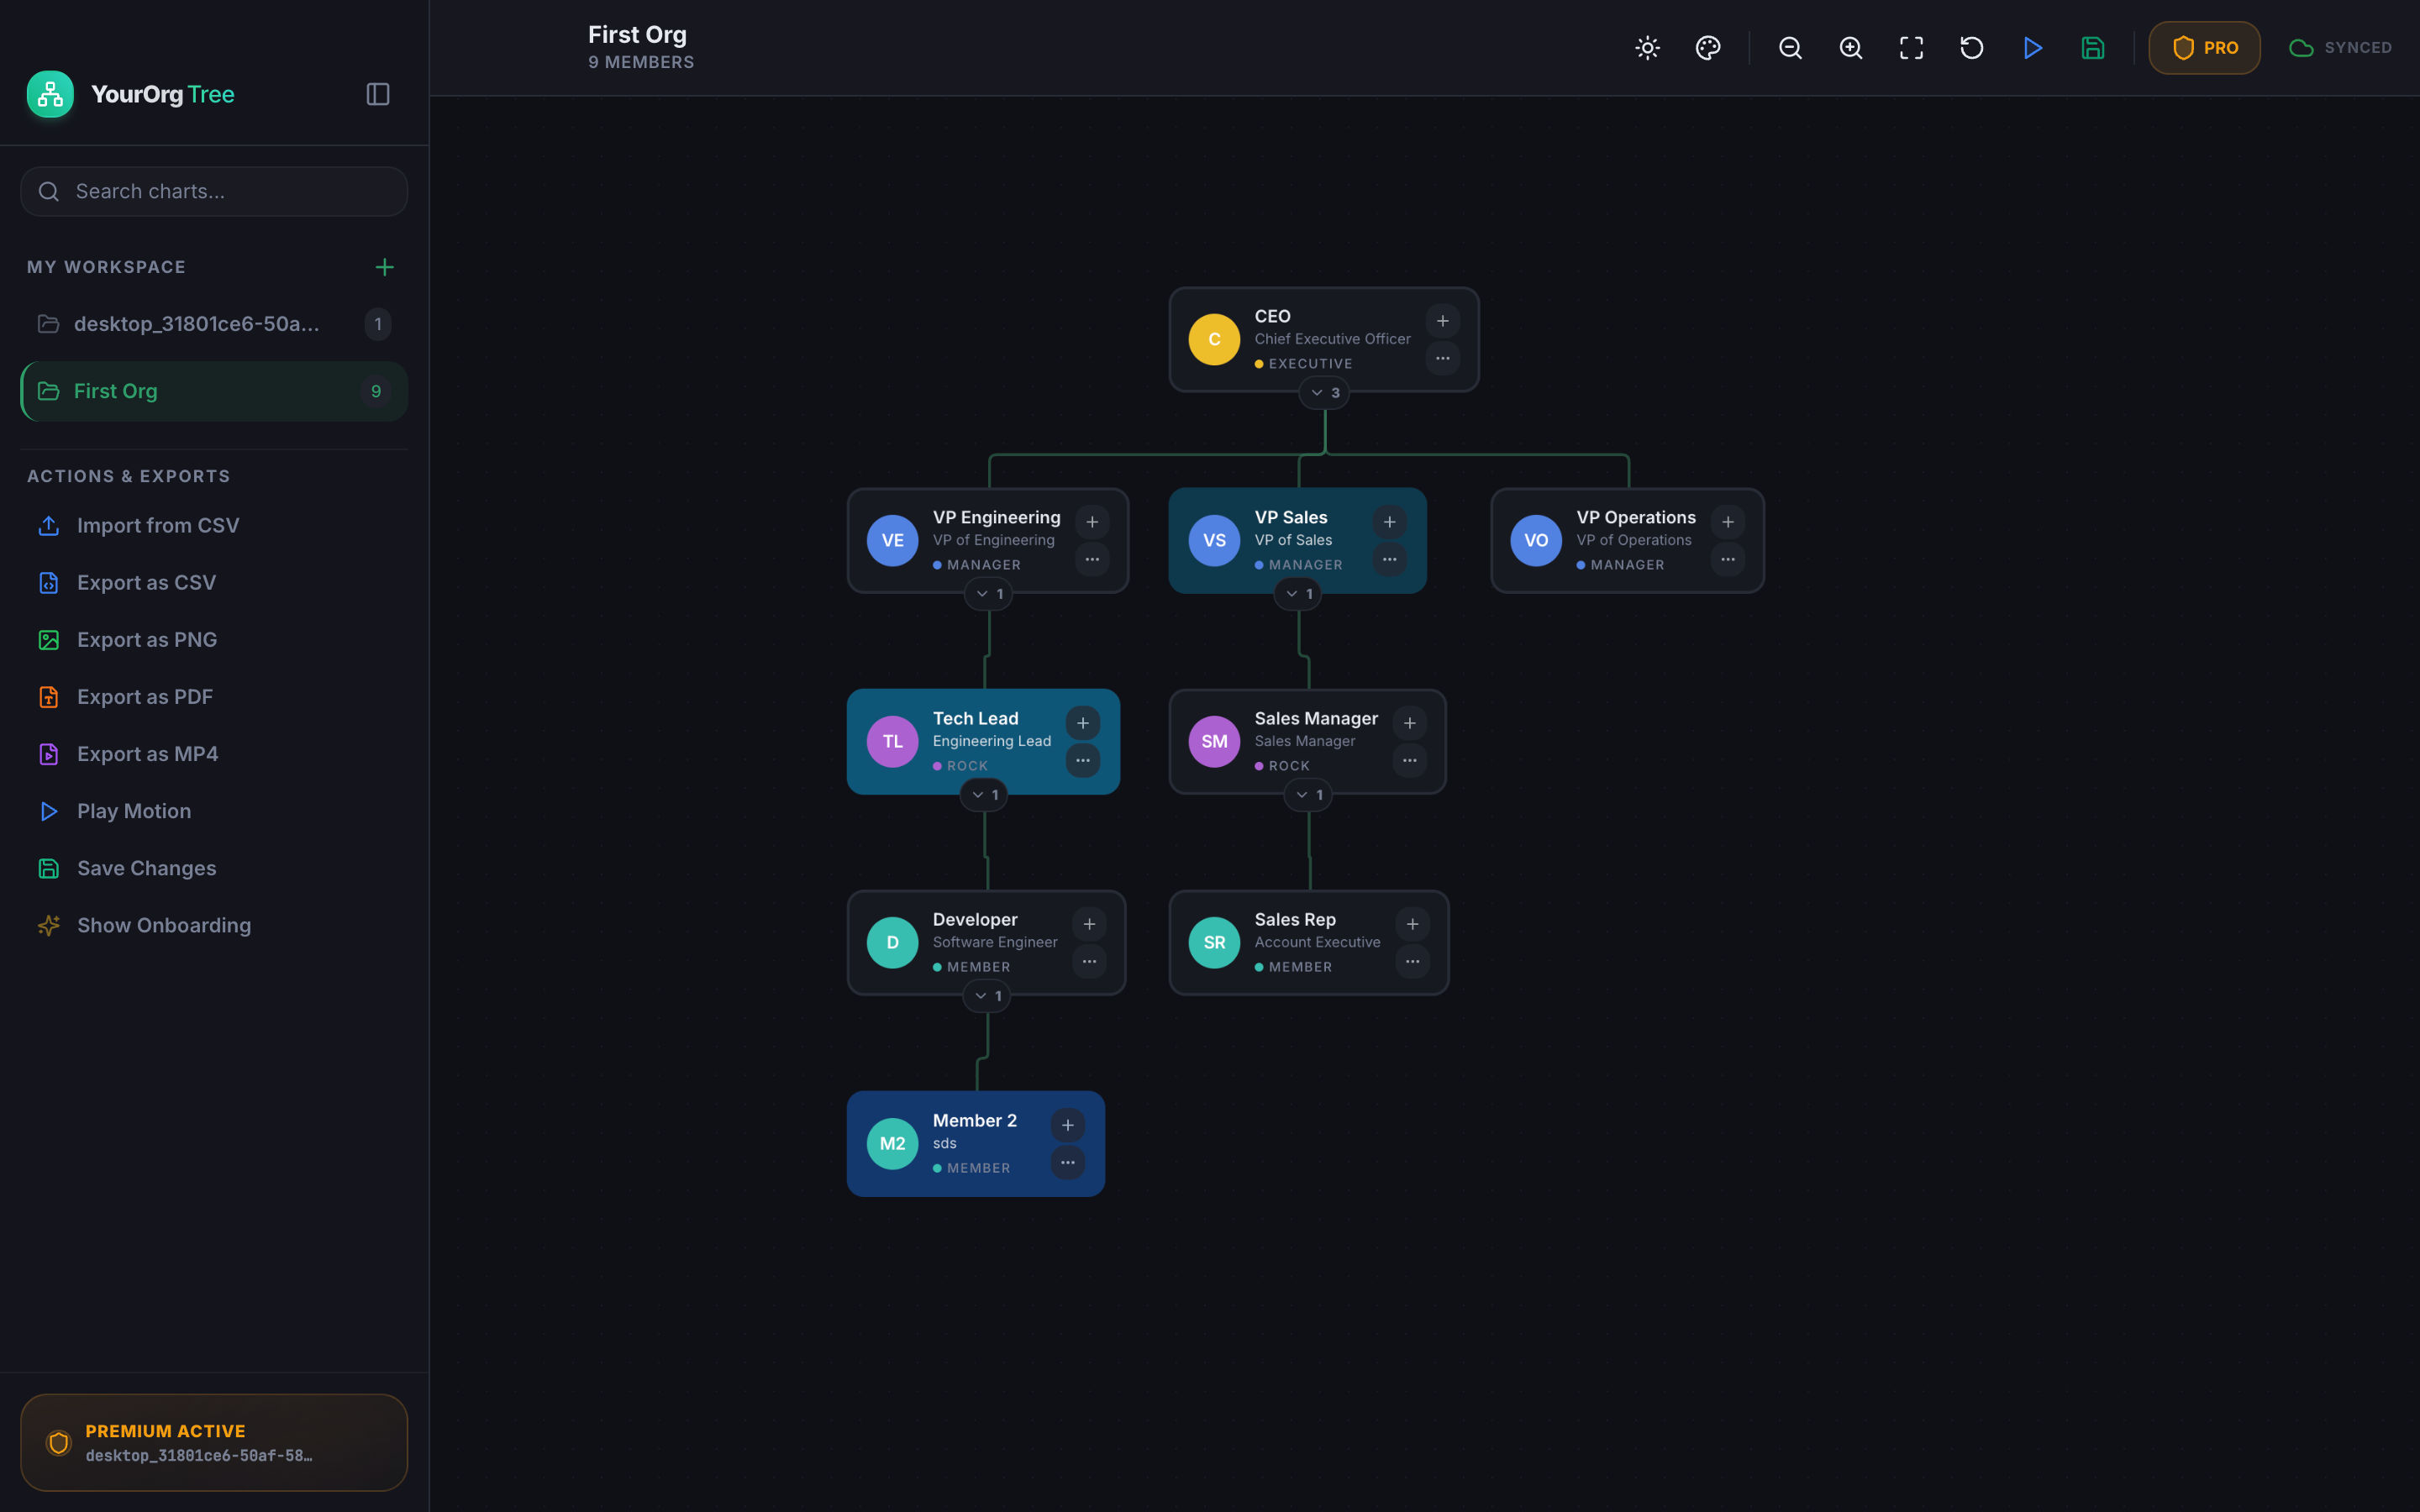
Why Traditional Org Chart Makers Fall Short
Most managers first turn to presentation software like PowerPoint or diagrams inside spreadsheets. While they get the job done for small diagrams under 5 members, they break down immediately when:
- Your team grows: Repositioning nodes requires manual line re-routing.
- You need customization: Standardizing shapes, fonts, and spacings takes hours.
- Data changes: Promoting a member means deleting and recreating multiple lines and connection points.
To solve this, you need a dedicated, automated organizational chart maker that does the design heavy lifting for you while keeping your organization's sensitive hierarchy data completely secure.
Security & Sync
YourOrgTree runs locally for chart rendering and editing, but it also supports secure cloud synchronization. If you link your account, your org charts are securely backed up in the cloud via Convex cloud services, letting you sync structures across devices.
Step-by-Step: Creating an Org Chart Natively on Windows
Building a tree with YourOrgTree is fast and simple. Follow this guide to go from a blank canvas to a fully customized diagram in minutes.
1Download and Install YourOrgTree
First, install the native app on your Windows 10 or 11 system. You can download the signed package directly from the Microsoft Store listing .
2Define Your Root Node (The CEO or Founder)
Start by creating the top-level member of the tree. Enter their name, job title, department, and upload an avatar photo if desired. You can add additional fields like contact email, location, or direct phone extension to make the diagram double as an interactive team directory.
3Automate Building via CSV Import
This is the fastest method to scale your tree. Instead of entering each person manually:
- Prepare a CSV spreadsheet with three columns:
Id,Name, andReportsTo. - Ensure the
ReportsTocolumn matches the corresponding manager'sId. - Drag and drop the spreadsheet into the editor. YourOrgTree will instantly model your complete structure automatically.
4Customize Themes and Colors
Aesthetics play a large role in clarity. With the built-in customization settings, you can adjust:
- Node Styles: Card borders, corner roundness, and shadow strength.
- Spacing: The vertical and horizontal density of nodes to fit more people on the screen.
- Node Themes: Color-code departments (e.g. engineering in blue, sales in green) or highlight specific nodes with custom highlight borders.
5Save and Sync via Convex Cloud
Keep your charts safe and in sync. YourOrgTree integrates with Convex cloud services to backup your charts securely. Free tier users are limited to 1 active chart, while upgrading to Pro lets you create, save, and sync unlimited charts across devices.
6Export Your Finished Structure
Sharing a static file or dynamic link is simple. YourOrgTree supports high-definition PNG and JPEG exports for slide decks. Pro users can also export print-ready vector PDFs or an animated MP4 video clip walkthrough that glides through departments automatically.
Free vs. Pro Features
Whether you are mapping out a startup team or standardizing hierarchy rules for an entire enterprise, choose the license tier that fits your size:
| Feature | Free Version | Pro Version (Lifetime) |
|---|---|---|
| Maximum Node Capacity | Up to 10 nodes | Unlimited nodes |
| Organization Charts | 1 active chart | Unlimited charts |
| Basic Layout Editing | Yes | Yes |
| Node-Specific Custom Themes | No | Yes |
| Export Formats | PNG / JPEG | PNG, JPEG, PDF, MP4, CSV |
| Live Web Link Sharing | No | Yes |
Best Practices for Designing Readable Org Charts
- Establish Clear reporting paths: Each node should connect to only one immediate manager to keep hierarchy lines clean and prevent visual clutter.
- Standardize role structures: Use consistent text formats for role titles (e.g. write "VP of Product" rather than mix "Product Director" and "Product VP").
- Leverage colors strategically: Avoid assigning a unique color to every single person. Instead, color-code by department or hierarchy depth level.
Frequently Asked Questions
Is my employee structure data safe in YourOrgTree?
Yes, completely. While the app performs rendering locally on your computer, your data is securely backed up and synced via Convex cloud services if you link your account. Convex is an industry-grade, reactive database, ensuring your company structure remains private and encrypted.
Can I share my chart with other team members who don't have the app?
Yes! With the Pro version, you can generate a secure, interactive live web link. They can open this link on their web browsers, scroll, zoom, and explore the hierarchy structure without installing any software.
How are payments processed for the Pro license?
Upgrades to the Pro version are processed outside the Microsoft Store using Dodo Payments, ensuring a secure and hassle-free transaction directly from the application interface.
Build Your First Org Chart Today
Download YourOrgTree for Windows directly from the Microsoft Store. Create structured, beautiful, and dynamic charts for your team instantly.
Compatible with Windows 10 (version 14316.0 or higher) and Windows 11.